⚡ Direct Answer: Peak Sun Hours by State
Across the United States, peak sun hours by state range from an annual average of 2.65 hours per day in Alaska to 6.57 hours per day in Arizona. Most continental states receive between 3.8 and 5.2 peak sun hours daily. One peak sun hour does not equal one hour of daylight; it represents exactly 1,000 watts per square meter (1 kW/m²) of solar irradiance integrated over time. For grid-tied installations, system sizing uses the annual daily average. However, for off-grid solar systems, array capacity must be engineered around your state’s winter solstice minimum (typically December or January) to avoid battery bank depletion during the shortest days of the year.
If you look at the weather forecast in Phoenix and see fourteen hours of blazing summer daylight, you might assume your solar panels are producing full rated nameplate power for fourteen continuous hours. They are not. The sun spends hours rising at shallow angles through thick atmospheric air mass, peaks around solar noon with intense direct irradiance, and fades gradually into evening shadows.
Assuming that daylight hours equal productive solar hours is the single most expensive sizing mistake in DIY renewable energy. A solar array rated for 5,000 watts does not produce 5 kW multiplied by 14 hours of sunlight. Solar panels respond to solar radiation intensity, not ambient brightness. To design a reliable off-grid power plant or size a home solar array, solar engineers compress an entire day of varying sunlight into a single standardized metric: Peak Sun Hours (PSH).
1. What is a Peak Sun Hour? (The Physics of Solar Irradiance)
A Peak Sun Hour (PSH) is defined as an accumulated solar irradiance equal to 1,000 watts per square meter (1,000 W/m² or 1 kW/m²) hitting a surface over a one-hour duration. In metric energy units, one peak sun hour delivers exactly 1 kilowatt-hour of solar energy per square meter (1 kWh/m²).
Standard Test Conditions (STC)—the laboratory benchmark used by manufacturers to rate photovoltaic module wattage—rate solar panels under an artificial light flash of exactly 1,000 W/m² at a cell temperature of 25°C (77°F). Therefore, when a location receives 5.0 peak sun hours in a single day, it means that a 400-watt solar panel in that location will produce the theoretical equivalent of running at its full 400-watt capacity for exactly 5 hours:
For example, if you position a 400 W monocrystalline panel in Colorado where the annual daily average is 5.25 PSH, the gross daily harvest is 400 W × 5.25 = 2,100 watt-hours (2.1 kWh) before accounting for thermal, wiring, and inverter losses. Understanding this distinction is vital: a cloudy 12-hour summer day in Seattle might deliver only 2.2 PSH, whereas a crisp 9-hour autumn day in Albuquerque can easily yield 5.8 PSH.
2. Complete 50-State Peak Sun Hours by State Table (NREL Verified Data)
To evaluate solar potential for your specific location, consult the empirical peak sun hours by state benchmarks compiled below. Derived from the National Renewable Energy Laboratory (NREL) National Solar Radiation Database (NSRDB) and calibrated through PVWatts irradiance models, these values represent global horizontal and latitude-tilted insolation expressed in daily peak sun hours (kWh/m²/day).
| U.S. State | Annual Average (PSH/Day) | Summer Peak (June/July) | Winter Minimum (Dec/Jan) | Solar Resource Zone |
|---|---|---|---|---|
| Alabama | 4.23 | 5.30 | 3.10 | Southeast Moderate |
| Alaska | 2.65 | 4.80 | 0.60 | Sub-Arctic / Extreme Seasonal |
| Arizona | 6.57 | 7.60 | 4.90 | Southwest Arid (Top Tier) |
| Arkansas | 4.42 | 5.40 | 3.10 | South Central |
| California | 5.65 | 7.10 | 3.80 | Pacific West (High Solar) |
| Colorado | 5.25 | 6.30 | 3.90 | Mountain West / High Plains |
| Connecticut | 3.90 | 4.90 | 2.40 | Northeast Coastal |
| Delaware | 4.05 | 5.10 | 2.60 | Mid-Atlantic |
| Florida | 5.30 | 5.80 | 4.10 | Subtropical Humid |
| Georgia | 4.55 | 5.40 | 3.20 | Southeast Moderate |
| Hawaii | 5.85 | 6.50 | 4.80 | Tropical (Year-Round High) |
| Idaho | 4.30 | 6.10 | 2.10 | Northern Intermountain |
| Illinois | 3.95 | 5.20 | 2.20 | Midwest Plains |
| Indiana | 3.80 | 5.00 | 2.00 | Midwest Plains |
| Iowa | 4.25 | 5.40 | 2.40 | Upper Midwest |
| Kansas | 4.90 | 6.10 | 3.10 | Central Plains |
| Kentucky | 3.90 | 5.00 | 2.30 | Ohio Valley |
| Louisiana | 4.45 | 5.20 | 3.20 | Gulf Coast |
| Maine | 3.85 | 4.80 | 2.30 | Northern New England |
| Maryland | 4.15 | 5.20 | 2.70 | Mid-Atlantic |
| Massachusetts | 3.90 | 4.90 | 2.30 | Northeast Coastal |
| Michigan | 3.65 | 5.00 | 1.80 | Great Lakes (Cloudy Winter) |
| Minnesota | 4.15 | 5.40 | 2.10 | Upper Midwest |
| Mississippi | 4.40 | 5.30 | 3.10 | Southeast Gulf |
| Missouri | 4.45 | 5.50 | 2.80 | Midwest Transition |
| Montana | 4.25 | 6.00 | 1.90 | Northern Mountain |
| Nebraska | 4.75 | 5.90 | 2.90 | Central Plains |
| Nevada | 6.41 | 7.50 | 4.60 | Southwest Desert (Top Tier) |
| New Hampshire | 3.85 | 4.80 | 2.20 | Northern New England |
| New Jersey | 4.05 | 5.10 | 2.60 | Mid-Atlantic Coastal |
| New Mexico | 6.40 | 7.30 | 4.80 | Southwest High Desert |
| New York | 3.75 | 4.80 | 1.90 | Northeast / Great Lakes |
| North Carolina | 4.50 | 5.30 | 3.20 | Southeast Atlantic |
| North Dakota | 4.15 | 5.60 | 2.00 | Northern Plains |
| Ohio | 3.75 | 4.90 | 1.90 | Midwest Industrial |
| Oklahoma | 5.00 | 6.10 | 3.30 | Southern Plains |
| Oregon | 3.80 | 5.80 | 1.60 | Pacific Northwest (Western Rain) |
| Pennsylvania | 3.80 | 4.90 | 2.00 | Mid-Atlantic Appalachian |
| Rhode Island | 3.90 | 4.90 | 2.30 | Northeast Coastal |
| South Carolina | 4.60 | 5.40 | 3.30 | Southeast Atlantic |
| South Dakota | 4.50 | 5.80 | 2.60 | Central High Plains |
| Tennessee | 4.15 | 5.10 | 2.60 | South Central Valley |
| Texas | 5.20 | 6.20 | 3.60 | South (West TX reaches 6.1) |
| Utah | 5.40 | 6.80 | 3.40 | Colorado Plateau / Basin |
| Vermont | 3.65 | 4.60 | 1.90 | Northern New England |
| Virginia | 4.25 | 5.20 | 2.80 | Mid-Atlantic Transition |
| Washington | 3.60 | 5.60 | 1.30 | Pacific Northwest (Cloudy Winter) |
| West Virginia | 3.70 | 4.80 | 2.00 | Appalachian Plateau |
| Wisconsin | 3.95 | 5.10 | 2.00 | Upper Midwest |
| Wyoming | 5.15 | 6.40 | 3.30 | High Altitude Plateau |

3. How to Calculate Solar Array Size Using Peak Sun Hours by State
To convert your local peak sun hours by state value into a tangible hardware specification (total array wattage and panel count), follow this proven engineering formula:
The 0.80 System Derate Factor (20% loss) accounts for unavoidable real-world electrical physics:
- Thermal Derating (10% to 12%): Solar cells lose roughly 0.35% to 0.40% efficiency for every degree Celsius above 25°C. In summer sun, dark roof panels easily heat up to 55°C–65°C (130°F–150°F).
- Inverter Conversion Losses (6% to 10%): Converting 48V DC power into 120V/240V AC electricity operates at 90% to 94% efficiency.
- DC and AC Wiring Voltage Drop (2% to 3%): Resistance in conductors and combiner box breakers.
- Soiling and Surface Dust (3% to 5%): Atmospheric pollen, dirt, and airborne particles.
Worked Example: Ohio vs. Arizona
Consider an off-grid home consuming an average of 25 kWh per day (including refrigeration, lighting, water pumping, and intermittent cooking). Let us examine how geography dramatically alters equipment requirements:
Scenario A: Columbus, Ohio (Annual Average: 3.75 PSH)
Effective daily production factor = 3.75 PSH × 0.80 derate = 3.00 effective hours/day.
Required Array Size = 25 kWh ÷ 3.00 = 8.33 kW (8,330 Watts).
Using standard 400-watt monocrystalline panels: 8,330 W ÷ 400 W = 20.8 → 21 Solar Panels needed.
Scenario B: Tucson, Arizona (Annual Average: 6.57 PSH)
Effective daily production factor = 6.57 PSH × 0.80 derate = 5.256 effective hours/day.
Required Array Size = 25 kWh ÷ 5.256 = 4.75 kW (4,750 Watts).
Using standard 400-watt monocrystalline panels: 4,750 W ÷ 400 W = 11.8 → 12 Solar Panels needed.
To produce the exact same 25 kWh of daily electricity, a homeowner in Ohio must purchase, mount, and wire 75% more solar panels than a homeowner in sunny Arizona. This stark difference illustrates why national generic solar kits frequently fail when deployed in northern climates.
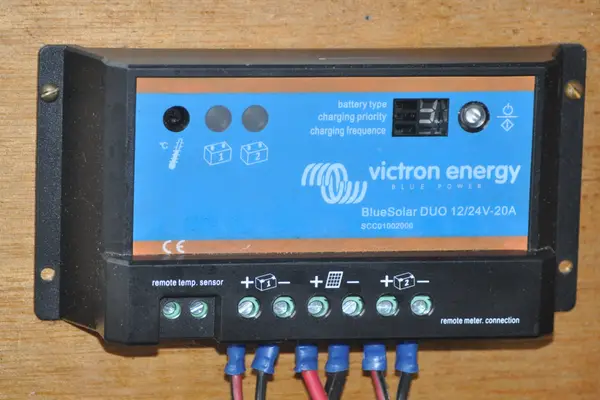
Once you calculate your total array wattage, you must ensure that your charge controller can safely manage the incoming photovoltaic current. Consult our comprehensive Solar Charge Controller Sizing Guide to match your panel array with the right MPPT amperage rating, and see our Home Solar Battery Sizing Guide to calculate nighttime kilowatt-hour reserves.
4. The Off-Grid Trap: Why Winter PSH Dictates Your Survival
If you are connected to the commercial electric utility with a net-metering agreement, sizing your solar system around your state’s Annual Average PSH is completely fine. In summer, your excess kilowatt-hours export to the grid, banking credits that offset your winter deficit.
However, if you live in an off-grid cabin, homestead, or mobile tiny home, the grid does not exist to rescue you. Sizing an off-grid system based on annual average sun hours is the primary cause of dead battery banks and frantic mid-winter generator runs:
- Washington State: Annual average is 3.60 PSH. In July, you enjoy a generous 5.60 PSH. But in December, solar insolation drops to an abysmal 1.30 PSH—a 77% plunge in daily generation!
- Michigan: Drops from 5.00 PSH in summer to 1.80 PSH in winter, exacerbated by heavy snow cover and overcast Great Lakes moisture.
- New York: Drops from 4.80 PSH down to 1.90 PSH in December.
- Size your solar array based on your state’s Winter Minimum PSH (which will produce massive summer surplus, but ensures winter independence), OR
- Integrate a dual-fuel auto-start inverter generator to supply supplemental battery charging when solar harvests fall short. Never assume an annual average will sustain you through December blizzards.
When operating in northern climates where winter insolation drops below 2.0 PSH and ambient temperatures plummet, maintaining your battery bank’s thermal health is equally critical. For safety guidelines on charging lithium cells in freezing conditions without triggering internal plating, review our practical LiFePO4 Cold Weather Charging Guide.
5. How to Boost Real-World Sun Hours on Your Property
While you cannot change your state’s geographic latitude, you can make engineering adjustments to capture significantly more irradiance than horizontal flat tables suggest:
1. Steep Seasonal Panel Tilt Angles
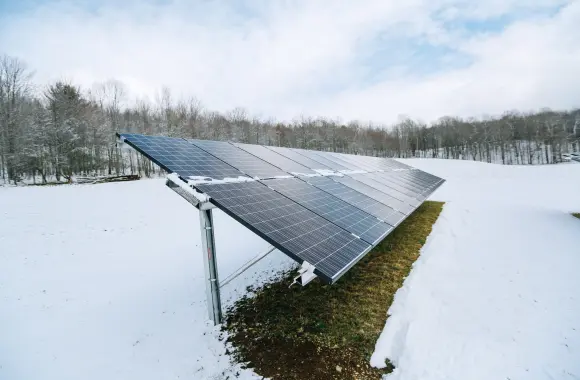
In winter, the sun sits low on the southern horizon (peaking at barely 25° to 30° altitude in the northern U.S.). Flat roof-mounted panels suffer catastrophic cosine losses. Adjusting your solar array to a steep winter tilt angle (Latitude + 15°, typically 50° to 60° tilt) accomplishes two critical functions: it positions panels perpendicular to low-angle winter rays and allows heavy snowfall to slide off freely.
2. Ground-Mounted Arrays vs. Fixed Roofs
Rooftop solar arrays are permanently locked to whatever compass azimuth and slope your builder chose. A ground-mounted racking system allows you to face true solar south (accounting for regional magnetic declination) and adjust tilt seasonally (spring, summer, and winter), boosting captured PSH by 15% to 25% annually.
3. Bifacial Solar Panels
In snowy northern states (Montana, Minnesota, Wisconsin, Maine), bifacial double-glass panels capture reflected sunlight (albedo effect) bouncing off white snow onto the underside of the modules. This reflected light can generate an extra 10% to 20% output during cold, high-reflection winter mornings.
Official PV production and system derate loss simulation engine.
Visit NREL PVWatts →
DOE Office of Energy Efficiency & Renewable Energy (EERE) solar basics.
Explore DOE EERE →
National Electrical Code solar photovoltaic system design and overcurrent standards.
View NFPA Standard →