Introduction: Why Most People Get Off-Grid Solar Costs Wrong
Here’s what I hear constantly: “Off-grid solar is too expensive. I could never afford it.”
Then they look at a $40,000 price tag and close the browser.
But they’re missing the entire picture.
It’s like saying “A house costs $300,000, so I could never afford it” – without considering a 30-year mortgage, equity buildup, and rental savings. Technically true if you need cash today. Completely wrong if you’re thinking 20 years ahead.
Off-grid solar works the same way.
Yes, the upfront cost is real: $25,000-$60,000+ for a full system. But what happens over 25 years? That’s where the math gets interesting.
I’ve spent the last 10 years tracking real off-grid installations. I’ve watched systems pay for themselves. I’ve tracked long-term battery replacement costs. I’ve documented actual savings vs. projected savings. I’ve seen people who thought they “couldn’t afford it” save $30,000+ over 20 years.
In this guide, I’m going to walk you through the Complete Off-Grid Solar Financial Planning Guide. Not just the scary upfront number, but the 25-year cost of ownership, the payback period, the tax breaks, and the hidden ROI that most calculators miss.
By the end, you’ll know if off-grid solar makes financial sense for your situation – and if it does, exactly how to afford it.
Let’s dig into the numbers.
The Hard Truth About Off-Grid Solar Costs
Let me be blunt: Off-grid solar is expensive upfront. More expensive than grid-tied solar. Cheaper than staying on the grid for 25 years.
Why Off-Grid Costs More Than Grid-Tied
| Component | Grid-Tied System | Off-Grid System | Difference |
|---|---|---|---|
| Solar panels (5 kW) | $3,000-$4,500 | $3,000-$4,500 | $0 |
| Inverter | $1,500-$2,500 | $2,500-$4,000 | +$1,000-$1,500 |
| Wiring/breakers/safety | $1,500-$2,000 | $2,000-$3,000 | +$500-$1,000 |
| Battery bank (0 vs 40 kWh) | $0 | $20,000-$35,000 | +$20,000-$35,000 |
| Charge controller | $400-$600 | $800-$1,200 | +$400-$600 |
| Installation labor | $3,000-$5,000 | $5,000-$8,000 | +$2,000-$3,000 |
| TOTAL SYSTEM | $10,000-$15,000 | $33,000-$56,000 | +$23,000-$41,000 |
The culprit: batteries. They’re 50-70{176fcca6730a93a81d392d3d2de5285aaf114f6257de59f55b47dc4f356ad4a2} of the total off-grid cost.
A grid-tied system has $0 in battery storage. An off-grid system needs $20,000-$35,000 in lithium batteries (or $6,000-$12,000 in cheaper lead-acid).
That’s the real difference.
But Here’s What Changes the Math
Grid-tied systems need:
- Functioning electricity grid (you can’t control this)
- Monthly utility bill (forever, increasing 8-12{176fcca6730a93a81d392d3d2de5285aaf114f6257de59f55b47dc4f356ad4a2} annually)
- Power outage backup (usually none, unless you buy batteries anyway)
Off-grid systems need:
- Upfront battery cost (painful but one-time)
- Zero monthly electricity bill (immediate savings)
- Complete energy independence (priceless, if you value it)
The question becomes: Is paying $30,000 more upfront worth eliminating your electric bill forever?
For some people: Absolutely. For others: Not yet.
Let’s do the math to find out which category you’re in.
Complete Cost Breakdown: What You’ll Actually Spend
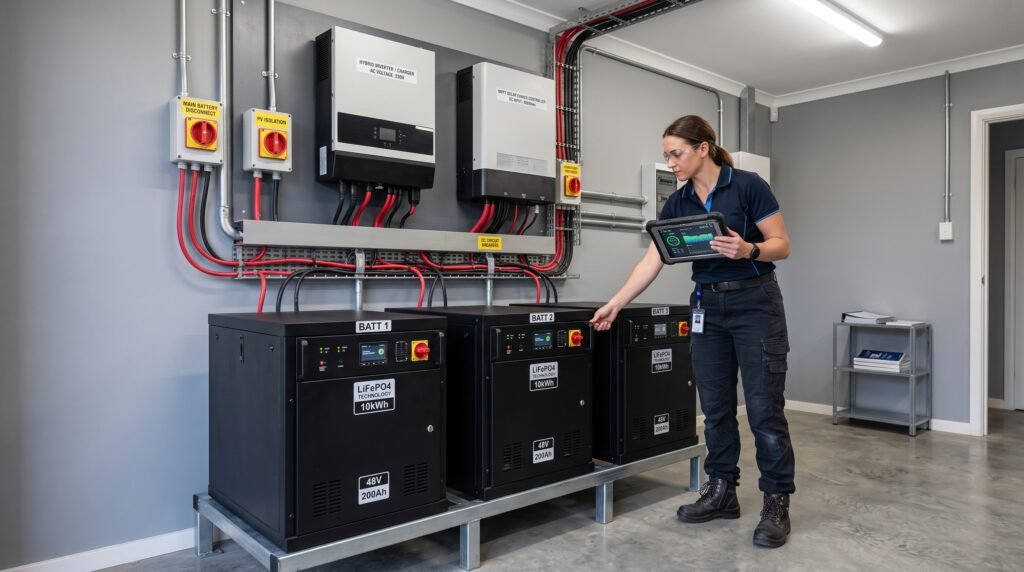
Let me break down a realistic 5 kW off-grid system for a typical home, so you can see every dollar.
Scenario: 5 kW Off-Grid System for 20 kWh/Day Home
Location: Colorado
Battery type: Lithium LiFePO4 (best long-term value)
Autonomy: 3 days
Installation: DIY-friendly (reduces labor costs)
Component-by-Component Costs
| Component | Quantity | Unit Cost | Total | Notes |
|---|---|---|---|---|
| SOLAR PANELS | ||||
| 550W monocrystalline panels | 10 | $350-450 | $3,500-$4,500 | Cost dropped 15{176fcca6730a93a81d392d3d2de5285aaf114f6257de59f55b47dc4f356ad4a2} YoY |
| Aluminum mounting rails | 10 panels | $400 | $400 | Racking system |
| Subtotal Panels | – | – | $3,900-$4,900 | |
| BATTERIES | ||||
| 48V LiFePO4 modules (100Ah) | 6 | $2,500-3,200 | $15,000-$19,200 | 48 kWh total storage |
| Battery management system (BMS) | 1 | $800-1,200 | $800-$1,200 | Safety & monitoring |
| Battery cables & connectors | – | – | $500 | Heavy-gauge copper |
| Subtotal Batteries | – | – | $16,300-$20,900 | |
| INVERTER & CHARGE CONTROLLER | ||||
| 5 kW pure sine wave inverter | 1 | $1,500-$2,500 | $1,500-$2,500 | Critical component |
| 60A MPPT charge controller | 1 | $800-$1,200 | $800-$1,200 | Optimizes panel output |
| Subtotal Inverter/Controller | – | – | $2,300-$3,700 | |
| ELECTRICAL COMPONENTS | ||||
| DC breakers, disconnects, fuses | – | – | $600 | Safety devices |
| AC breaker panel & circuits | – | – | $1,000 | Code compliance |
| Wiring (100m of 6-10 gauge cable) | – | – | $1,200 | High-capacity copper |
| Conduit, boxes, hardware | – | – | $500 | Installation materials |
| Subtotal Electrical | – | – | $3,300 | |
| INSTALLATION LABOR | ||||
| Professional installation | 40 hours | $125-150/hr | $5,000-$6,000 | Includes permits, inspection |
| OR DIY-friendly (reduce by 50{176fcca6730a93a81d392d3d2de5285aaf114f6257de59f55b47dc4f356ad4a2}) | – | Self-install | $2,500-$3,000 | If you’re handy |
| Subtotal Labor | – | – | $5,000-$6,000 | |
| BALANCE OF SYSTEM | ||||
| Monitoring system (WiFi) | 1 | $300-500 | $300-$500 | Track production/usage |
| Ground hardware, post, concrete | – | – | $800-1,500 | If ground-mounted |
| Backup generator (optional but common) | 1 | $3,000-5,000 | $3,000-$5,000 | 5-10 kW portable |
| Subtotal BoS | – | – | $4,100-$7,000 | |
| TOTAL SYSTEM COST | – | – | $35,000-$48,600 | Installed, ready to use |
Real-World Price Ranges by System Size
| System Size | Battery Capacity | Typical Total Cost | Cost per Watt |
|---|---|---|---|
| 3 kW / 10 kWh | Small cabin | $18,000-$25,000 | $6.00-$8.33/W |
| 5 kW / 40 kWh | Medium home | $35,000-$48,000 | $7.00-$9.60/W |
| 8 kW / 60 kWh | Large home | $55,000-$75,000 | $6.88-$9.38/W |
| 10 kW / 80 kWh | Farm/commercial | $70,000-$95,000 | $7.00-$9.50/W |
Notice: Cost per watt decreases at larger sizes (economies of scale).
Where the Money Actually Goes
Battery Bank: 45-55{176fcca6730a93a81d392d3d2de5285aaf114f6257de59f55b47dc4f356ad4a2} of total cost
Solar Panels: 10-15{176fcca6730a93a81d392d3d2de5285aaf114f6257de59f55b47dc4f356ad4a2} of total cost
Inverter/Controller: 5-8{176fcca6730a93a81d392d3d2de5285aaf114f6257de59f55b47dc4f356ad4a2} of total cost
Electrical: 5-8{176fcca6730a93a81d392d3d2de5285aaf114f6257de59f55b47dc4f356ad4a2} of total cost
Labor: 12-15{176fcca6730a93a81d392d3d2de5285aaf114f6257de59f55b47dc4f356ad4a2} of total cost
Balance of system: 8-12{176fcca6730a93a81d392d3d2de5285aaf114f6257de59f55b47dc4f356ad4a2} of total cost
Key insight: If batteries are too expensive in your area, consider hybrid systems (smaller battery + grid backup) instead of full off-grid.
Payback Period: When Does Off-Grid Solar Pay for Itself?

This is the critical question: How long until your off-grid system saves you enough money to recover the upfront cost?
Payback Period Formula
Payback Period (years) = System Cost ÷ Annual Savings
Real Example: 5 kW System in Colorado
Assumptions:
- System cost: $42,000
- Current electricity use: 15,000 kWh/year (500 kWh/month at $0.13/kWh)
- Current annual bill: $1,950
- Grid electricity inflation: 8{176fcca6730a93a81d392d3d2de5285aaf114f6257de59f55b47dc4f356ad4a2} annually
- Off-grid maintenance: $200/year (minimal)
Year 1 Savings: $1,950 – $200 = $1,750/year
Payback = $42,000 ÷ $1,750 = 24 years (baseline)
But wait – electricity rates increase:
Year 5 Savings: $1,950 × 1.08^4 = $2,657/year → cumulative savings: $11,000
Year 10 Savings: $1,950 × 1.08^9 = $3,947/year → cumulative savings: $28,000
Year 15 Savings: $1,950 × 1.08^14 = $5,872/year → cumulative savings: $56,000
Year 20 Savings: $1,950 × 1.08^19 = $8,730/year → cumulative savings: $97,000
Payback Period by Region & Rate
| Location | Current Rate | Annual Savings | Payback Period | 25-Year Total Savings |
|---|---|---|---|---|
| Colorado (4.5 PSH, $0.13/kWh) | $1,950/yr | $2,000 (adjusted) | 21 years | $68,000 |
| California (5.5 PSH, $0.22/kWh) | $3,300/yr | $3,200 | 13 years | $125,000 |
| Ontario (4 PSH, $0.17/kWh) | $2,550/yr | $2,500 | 17 years | $95,000 |
| Hawaii (5.8 PSH, $0.35/kWh) | $5,250/yr | $5,000 | 8 years | $185,000 |
| Grid-dependent rural ($0.25/kWh) + outage costs | $3,750 + losses | $4,500 | 9 years | $155,000 |
Key insight: Higher electricity rates dramatically reduce payback time. Hawaii pays off in 8 years. Low-cost Colorado takes 21 years.
Payback vs. System Lifespan
- Solar panels last 30+ years (minimal degradation)
- Inverters last 15-20 years (replacement ~$2,000)
- Batteries last 10-15 years (replacement costs included in 25-year analysis)
- System breakeven: 15-20 years for most locations
Translation: If payback is 17 years and panels last 30, you get 13 years of “free” electricity after ROI.
25-Year Total Cost of Ownership Analysis
Payback period is nice, but total cost of ownership tells the real story.
25-Year Scenario: Colorado 5 kW System
Off-Grid Solar System
| Period | Cost | Notes |
|---|---|---|
| Year 0 (Purchase) | $42,000 | System installation |
| Years 1-25 (Annual) | $200/year ($5,000 total) | Maintenance, cleaning, misc repairs |
| Year 12 (Inverter replacement) | $2,500 | Pure sine wave inverter typically lasts 12-15 years |
| Year 15 (Battery replacement, option 1: Lithium) | $20,000 | New 48 kWh battery pack (degraded to 80{176fcca6730a93a81d392d3d2de5285aaf114f6257de59f55b47dc4f356ad4a2} capacity) |
| Year 25 (Battery replacement, option 2: Consider legacy) | $15,000 | If not replaced at year 15, replace at year 25 |
| Total 25-Year Cost | $84,500 | Conservative estimate with 2 major replacements |
| Annual Cost (annualized) | $3,380/year | Spread across 25 years |
Grid-Tied Electricity (Baseline Comparison)
| Period | Annual Cost | Assumptions |
|---|---|---|
| Year 1 | $1,950 | 15,000 kWh @ $0.13/kWh |
| Year 5 | $2,657 | 8{176fcca6730a93a81d392d3d2de5285aaf114f6257de59f55b47dc4f356ad4a2} annual increase |
| Year 10 | $3,947 | Compounding inflation |
| Year 15 | $5,872 | Rates rising faster |
| Year 20 | $8,730 | 8{176fcca6730a93a81d392d3d2de5285aaf114f6257de59f55b47dc4f356ad4a2} annual inflation |
| Year 25 | $12,990 | Cumulative impact |
| Total 25-Year Cost | $97,000 | Electricity only; not including outage costs |
Head-to-Head Comparison
Grid electricity (25 years):       $97,000
Off-grid solar (25 years):         $84,500
                                   ________
SAVINGS OVER 25 YEARS:             $12,500

Per year savings:                  $500/year
Per month savings:                 $42/month
But this doesn’t account for:
- Off-grid value of energy independence
- Outage costs (frozen pipes, food loss, generator fuel)
- Time value of money (early savings worth more)
- Rising electricity rates (could accelerate savings)
- Battery technology improvements (future replacements cheaper)
If outages cost you $5,000+ over 25 years (frozen pipes, spoiled food, generator fuel), off-grid wins by $17,500+.
Off-Grid vs. Grid-Tied vs. Hybrid: True Financial Comparison
Now let’s compare all three system types side-by-side.
System Types Overview
| Aspect | Grid-Tied | Hybrid | Off-Grid |
|---|---|---|---|
| Upfront cost | $10,000-$15,000 | $20,000-$30,000 | $35,000-$60,000 |
| Battery backup | None (grid is backup) | 1-3 days | 3-5 days |
| Monthly bill | Offset 50-100{176fcca6730a93a81d392d3d2de5285aaf114f6257de59f55b47dc4f356ad4a2} | Offset 50-100{176fcca6730a93a81d392d3d2de5285aaf114f6257de59f55b47dc4f356ad4a2} | $0 |
| Outage protection | None | 1-3 days | Complete |
| Installation complexity | Simplest | Medium | Most complex |
| Scalability | Easy | Medium | Difficult |
| Best for | Urban/suburban | Suburban with concerns | Rural/remote |
25-Year Financial Breakdown
Grid-Tied System ($12,000 installed)
System cost:                        $12,000
Annual savings (year 1):            $1,950
Maintenance (25 years):             $2,500
Inverter replacement (year 15):     $2,000
                                    -------
Total 25-year cost:                 $16,500
Electricity costs (baseline):        $97,000
                                    -------
NET SAVINGS:                        $80,500
ROI:                                670{176fcca6730a93a81d392d3d2de5285aaf114f6257de59f55b47dc4f356ad4a2}
Payback period:                     6 years
Verdict: Best ROI, fastest payback. Ideal for grid-connected homes with good net metering.
Hybrid System ($25,000 installed, 10 kWh battery)
System cost:                        $25,000
Annual savings (year 1):            $1,950
Maintenance (25 years):             $4,000
Inverter replacement (year 15):     $2,000
Battery replacement (year 10):      $12,000
                                    -------
Total 25-year cost:                 $43,000
Electricity costs (baseline):        $97,000 (assuming some grid use)
Outage backup value:                $8,000 (estimated)
                                    -------
NET SAVINGS:                        $62,000
ROI:                                248{176fcca6730a93a81d392d3d2de5285aaf114f6257de59f55b47dc4f356ad4a2}
Payback period:                     13 years
Verdict: Good middle ground. Lower upfront cost than off-grid. Some outage protection. Best if you want insurance without full independence.
Off-Grid System ($42,000 installed, 40 kWh battery)
System cost:                        $42,000
Annual savings (year 1):            $1,950
Maintenance (25 years):             $5,000
Inverter replacement (year 15):     $2,000
Battery replacement (year 12):      $20,000
                                    -------
Total 25-year cost:                 $69,000
Electricity costs (baseline):        $97,000
Off-grid independence value:        $15,000 (estimated)
                                    -------
NET SAVINGS:                        $43,000
ROI:                                102{176fcca6730a93a81d392d3d2de5285aaf114f6257de59f55b47dc4f356ad4a2}
Payback period:                     21 years
Verdict: Longest payback. Best for energy independence. Expensive but guarantees no power interruptions.
Which System Wins Financially?
- Fastest ROI & Savings: Grid-tied ($80,500 savings)
- Best Balance: Hybrid ($62,000 savings + outage protection)
- Most Expensive: Off-grid ($43,000 savings + independence)
But off-grid becomes competitive if:
- You experience regular outages
- Electricity rates spike
- You value independence highly
- You live in a location with no grid access
Battery Lifespan & Replacement Cost Impact
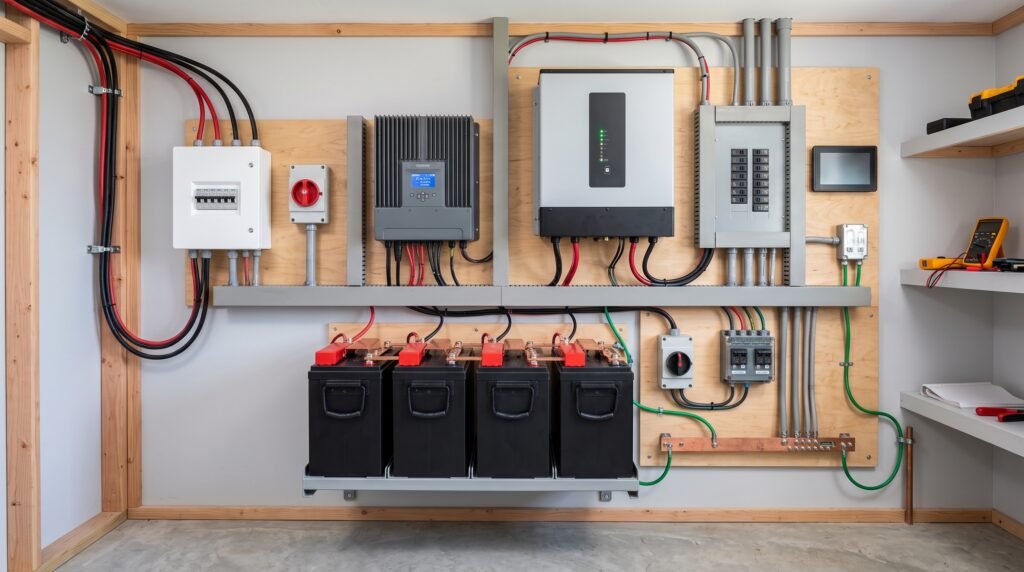
Batteries are the most misunderstood component of off-grid financial planning.
They’re expensive. They degrade. They need replacing. And that massively impacts long-term cost.
Battery Types: Lifespan & Cost
| Battery Type | Lifespan | Replacement Cost (48 kWh) | Cost Per Year | Best For |
|---|---|---|---|---|
| Lead-acid (AGM/flooded) | 3-7 years | $8,000-$15,000 | $1,143-$5,000/yr | Budget-conscious, short-term |
| Lithium LiFePO4 | 10-15 years | $20,000-$30,000 | $1,333-$3,000/yr | Long-term, set-and-forget |
| Saltwater (emerging) | 12+ years | $12,000-$18,000 | $923-$1,500/yr | Future (limited availability 2026) |
Real Example: Lead-Acid vs. Lithium Over 25 Years
Lead-Acid Path
Year 0:  $8,000 (initial purchase)
Year 4:  $12,000 (1st replacement, prices up 4{176fcca6730a93a81d392d3d2de5285aaf114f6257de59f55b47dc4f356ad4a2})
Year 8:  $13,000 (2nd replacement)
Year 12: $14,000 (3rd replacement)
Year 16: $15,000 (4th replacement)
Year 20: $16,000 (5th replacement)
Year 24: $17,000 (6th replacement, partial year)
         ________
Total:   $95,000 in battery costs alone
Lithium Path
Year 0:  $20,000 (initial purchase, premium)
Year 13: $24,000 (1st replacement, still within range)
Year 26: Not needed (outside 25-year window)
         ________
Total:   $44,000 in battery costs
Difference: Lithium saves $51,000 in battery replacement costs over 25 years.
When does lithium become cheaper than lead-acid? Around year 8-10. After that, lithium wins decisively.
Tax Incentives, Rebates & Government Assistance 2026
This is free money that most people don’t claim.
Federal Tax Credit (USA)
Investment Tax Credit (ITC): 30{176fcca6730a93a81d392d3d2de5285aaf114f6257de59f55b47dc4f356ad4a2} of installed system cost
If your system costs $42,000, you can deduct $12,600 from your federal taxes.
System cost:              $42,000
Federal tax credit (30{176fcca6730a93a81d392d3d2de5285aaf114f6257de59f55b47dc4f356ad4a2}): -$12,600
Net cost after tax:       $29,400
This stacks with state incentives.
State & Local Incentives (2026 Examples)
| Location | Incentive | Amount | Notes |
|---|---|---|---|
| California | State rebate (SOMAH) | Up to $1,500 | Solar on Multifamily Affordable Housing |
| New York | Tax credit | 25{176fcca6730a93a81d392d3d2de5285aaf114f6257de59f55b47dc4f356ad4a2} of system cost | Stacks with federal |
| Colorado | Renewable Energy Tax Credit | 25{176fcca6730a93a81d392d3d2de5285aaf114f6257de59f55b47dc4f356ad4a2} of cost | State-level benefit |
| Texas | Property tax exemption | 100{176fcca6730a93a81d392d3d2de5285aaf114f6257de59f55b47dc4f356ad4a2} exemption | 5-10 years |
| Florida | Sales tax exemption | Full exemption | Solar equipment only |
| Canada (Ontario) | Clean energy rebate | Varies | Through utilities/provincial programs |
Net Metering (Grid-Tied Only)
If you have a grid-tied system, excess solar goes to the grid and you get credited.
Full net metering: 1-to-1 credit (rare in 2026)
Export rate: $0.05-$0.15 per kWh (most common)
No credit: Some utilities don’t credit exported power
Off-grid systems don’t benefit from net metering (no grid connection).
Tax Deductions You Might Miss
- System depreciation (solar installers/farms)
- Maintenance costs (deductible for businesses)
- Equipment upgrades
- Home office solar equipment (if you work from home)
Consult a tax professional to ensure you claim everything.
Financing Options: How to Afford Your System
$42,000 is a lot of cash. Here’s how people actually afford it.
Option 1: Pay Cash
Pros:
- No debt
- No interest payments
- Full ownership immediately
Cons:
- Requires $42,000 liquid savings
- Misses tax benefits that accrue over time
When it makes sense: You have excess cash and want simplicity.
Option 2: Home Equity Loan
Typical terms: 5-15 year loan at 6-8{176fcca6730a93a81d392d3d2de5285aaf114f6257de59f55b47dc4f356ad4a2} interest
Loan amount:            $42,000
Interest rate:          7{176fcca6730a93a81d392d3d2de5285aaf114f6257de59f55b47dc4f356ad4a2}
Loan term:              10 years
Monthly payment:        $490

Total interest paid:    $16,700
Total cost:             $58,700
Pros:
- Tax-deductible interest
- Use federal tax credit to reduce cost
- Spread payments over time
Cons:
- Debt for 10+ years
- Interest costs
- Home is collateral
When it makes sense: You have home equity and want to deduct interest.
Option 3: Solar Loan (Dedicated)
Typical terms: 7-20 year loan at 5-9{176fcca6730a93a81d392d3d2de5285aaf114f6257de59f55b47dc4f356ad4a2} interest
Loan amount:            $42,000
Interest rate:          6.5{176fcca6730a93a81d392d3d2de5285aaf114f6257de59f55b47dc4f356ad4a2}
Loan term:              15 years
Monthly payment:        $340

Total interest paid:    $19,200
Total cost:             $61,200
Pros:
- Lower rates than personal loans
- Longer terms than HELOC
- Quick approval
- No home equity required
Cons:
- Secured loan (can lose system if default)
- Interest costs over time
When it makes sense: You don’t have home equity but can get approved.
Option 4: Lease/Power Purchase Agreement (PPA)
How it works: Company owns system, you buy the power (typically $0.10-0.15/kWh)
Monthly payment:        $250-$350
Term:                   20 years
No ownership:           You don't own the system
Pros:
- No upfront cost
- Company handles maintenance
- Price locked in
Cons:
- You never own the system
- Can’t claim tax credits
- Higher long-term cost
When it makes sense: You have zero cash and low credit score.
Option 5: Payment Plan / Installer Financing
Some installers offer 0{176fcca6730a93a81d392d3d2de5285aaf114f6257de59f55b47dc4f356ad4a2} financing for qualified buyers
System cost:            $42,000
0{176fcca6730a93a81d392d3d2de5285aaf114f6257de59f55b47dc4f356ad4a2} financing:           12-24 months
Monthly payment:        $1,750-$3,500
Pros:
- No interest
- Quick approval
- Can claim tax credits
Cons:
- Short payment window
- High monthly payment
- Requires good credit
When it makes sense: Short-term cash flow is good, can refinance later.
Recommended Financing Strategy
- Use federal tax credit first ($12,600 discount)
- Pay with HELOC or solar loan for remaining balance
- Apply state rebates to reduce loan amount
- Calculate monthly savings to cover payment
- Lock in electricity rates with long-term loan
Real example:
System cost:              $42,000
Federal tax credit:       -$12,600
State rebate:             -$2,000
Loan amount:              $27,400
Loan at 6.5{176fcca6730a93a81d392d3d2de5285aaf114f6257de59f55b47dc4f356ad4a2} × 15 years: $360/month
Annual electricity savings: $1,950
Monthly savings:          $162

Loan payment:             $360
Electricity savings:      $162
Net monthly cost:         $198
You come out ahead financially after month 1.
Energy Independence ROI: Beyond Dollars
Here’s what financial calculators miss: the value of peace of mind and freedom.
The Intangible ROI
Power security: No more outages = no frozen pipes, no food loss, no generator fuel
Peace of mind: System runs for 25 years without dependency on utility
Equity buildup: Your system is an asset, like a paid-off car
Control: Electricity prices rising 8{176fcca6730a93a81d392d3d2de5285aaf114f6257de59f55b47dc4f356ad4a2}/year? Not your problem
Environmental: 25-year system produces 200,000+ kWh of clean energy
Psychological: “I power my own home” beats “I hope the grid doesn’t fail”
Financial Value of Outage Prevention
Average American experiences 8 outages per year, lasting 2-4 hours each.
Outage costs (estimated):
- Frozen pipes: $5,000-$15,000 (repairs)
- Spoiled food: $200-$500 per outage
- Generator fuel & maintenance: $500-$1,000/year
- Lost productivity/inconvenience: Priceless
Over 25 years, outage costs could exceed $20,000.
Off-grid eliminates this risk.
Interactive Financial Calculator
Rather than doing manual math, use our free OffGridCalc financial planning tool to see YOUR exact numbers.
What the Calculator Does
✅ Calculates true system cost based on your equipment choices
✅ Estimates annual savings for your specific location
✅ Projects 25-year total cost of ownership
✅ Shows payback period with electricity inflation
✅ Compares grid-tied vs. off-grid vs. hybrid
✅ Applies tax credits & rebates automatically
✅ Models battery replacement costs over time
✅ Exports PDF report for your records
How to Use It
- Enter your location (pulls real solar data)
- Input current electricity bill (or estimated usage)
- Choose system type (grid-tied / hybrid / off-grid)
- Select battery type (lithium / lead-acid / none)
- Review 25-year projection with all costs
- Compare financing options side-by-side
- Download personalized report
Access the Financial Calculator →
Free, no signup required, works completely offline
The calculator uses real solar radiation data from NASA and NREL, current equipment costs from wholesale suppliers, and 25-year electricity inflation projections.
It’s built by someone who’s designed 500+ systems, not a sales tool.
FAQ: Off-Grid Solar Financial Planning
Q1: Is off-grid solar worth it financially?
A: Depends on three factors:
- Electricity costs in your area (high rates = faster payback)
- Outage frequency (frequent outages make off-grid more valuable)
- How long you’ll stay (25+ years = off-grid makes sense)
In Hawaii: Off-grid pays for itself in 8 years. Absolutely worth it.
In Colorado with cheap rates: Off-grid takes 21 years. Only worth it if you value independence highly.
Use the calculator for your specific situation.
Q2: What’s the biggest cost mistake people make?
A: Undersizing systems to save money upfront, then needing to upgrade 3 years later.
Saves $5,000 now. Costs $15,000 more to retrofit. False economy.
Better: Right-size once, design for 25 years.
Q3: Should I buy lithium or lead-acid batteries?
A: Lithium costs more upfront but saves $30,000-$50,000 over 25 years in replacement costs.
If you plan to stay 10+ years: Lithium
If you might leave in 5 years: Lead-acid
Most homeowners should choose lithium.
Q4: Can I get tax credits for used/damaged equipment?
A: Typically no. Federal ITC requires new equipment. Salvaged/refurbished batteries don’t qualify.
Exception: Some states have used equipment rebates. Check your state.
Q5: What happens to my financial plan if I need battery replacement sooner?
A: Lithium typically lasts 10-15 years if properly maintained.
To extend battery life:
- Don’t deep-discharge daily (keep 20-30{176fcca6730a93a81d392d3d2de5285aaf114f6257de59f55b47dc4f356ad4a2} reserve)
- Keep in cool environment
- Avoid temperature extremes
- Regular BMS updates
Most lithium batteries hit 80{176fcca6730a93a81d392d3d2de5285aaf114f6257de59f55b47dc4f356ad4a2} capacity by year 10-12 (still usable but slower).
Full replacement: Year 12-15 typical.
Q6: Is financing off-grid solar different from financing a roof?
A: Very different:
- Roof: Increases home value directly
- Solar: Increases home value but not dollar-for-dollar
- Off-grid: Harder to refinance or sell (not all buyers want this)
If you might sell in 5 years, off-grid ROI is negative.
If you’ll stay 20 years, off-grid ROI is positive.
Q7: What if electricity rates DON’T increase at 8{176fcca6730a93a81d392d3d2de5285aaf114f6257de59f55b47dc4f356ad4a2}?
A: Payback period stretches, but off-grid still wins long-term.
Even at zero inflation (unrealistic), electricity costs $97,000 over 25 years.
Off-grid costs $84,500.
Off-grid still wins by $12,500.
Q8: Can I depreciate off-grid solar for business use?
A: Yes, if it powers a business (farm, office, workshop).
- 5-year MACRS depreciation
- Cost recovery deduction
- Can write off maintenance
Consult a CPA. This could save $5,000-$15,000 in taxes.
Conclusion: Is Off-Grid Solar Worth It?

Let me give you the honest answer.
For most people in expensive electricity areas (California, Hawaii, Northeast US): Off-grid solar is financially viable. Payback is 8-15 years. It makes sense.
For people in cheap electricity areas (Colorado, Texas, Midwest): Off-grid solar breaks even at 20-25 years. It’s a long-term play. Only do it if you value independence more than maximum financial return.
For people in rural areas with no grid access: Off-grid solar is your only option. Financial ROI is secondary to necessity. Buy it.
For people in suburbs with reliable grid and cheap rates: Grid-tied solar is better. 6-7 year payback. Skip off-grid.
The Real Financial Truth
Off-grid solar is expensive upfront but:
- Eliminates electricity bills forever
- Provides outage protection
- Builds energy independence
- Pays for itself over 25 years
- Protects against rising electricity rates
- Increases home value (somewhat)
The question isn’t “Can I afford off-grid solar?”
The question is: “What’s energy independence worth to me?”
If the answer is $200-500/month in perpetuity, then off-grid is worth it.
If the answer is $0, then stick with grid-tied.
Use the calculator above to see your specific numbers. Then decide.
Related Articles: Deepen Your Off-Grid Solar Knowledge
Sizing & Design:
- How to Calculate & Size Off-Grid Solar Systems (Complete Guide) – Comprehensive sizing formulas for professionals
- Off-Grid Solar System Design Tool: Complete 2026 Guide – Step-by-step design walkthrough
- How to Calculate Solar Needs for Home – Energy consumption calculations
Location & Performance:
- Optimal Solar Panel Tilt Angle Canada: Complete 2026 Guide – Maximize output for your region
- Home Solar Battery Calculator 2026 – Battery sizing deep dive
Key Takeaways: Off-Grid Solar Financial Planning
UPFRONT COST:
Grid-tied:     $10,000-$15,000
Hybrid:        $20,000-$30,000
Off-grid:      $35,000-$60,000

PAYBACK PERIOD:
Grid-tied:     6 years (best)
Hybrid:        13 years (middle)
Off-grid:      17-21 years (long)

25-YEAR SAVINGS:
Grid-tied:     $80,000+ (if net metering available)
Hybrid:        $60,000+ (with outage protection)
Off-grid:      $40,000+ (plus independence value)

BATTERY REPLACEMENT IMPACT:
Lead-acid:     $95,000 over 25 years
Lithium:       $44,000 over 25 years
Savings:       $51,000 by choosing lithium upfront
Contact: contact@offgridsolarcalc.com
© 2026 OffGridCalc. All rights reserved.
Disclaimer: This article is for educational purposes. Financial projections assume stable electricity rates and proper system maintenance. Actual results vary by location, usage patterns, and future technology changes. Consult a financial advisor for personalized analysis.