Direct Answer: A solar panel cold weather voltage spike occurs when ambient temperatures drop below the 25°C STC baseline, causing crystalline silicon bandgap expansion that increases open-circuit voltage (Voc) by 0.25% to 0.35% per degree Celsius. In sub-zero winter mornings, this elevation can push string voltage beyond MPPT limits, permanently puncturing internal switching MOSFETs unless calculated via NEC 690.7.
Engineering Principle: Preventing catastrophic winter charge controller destruction requires calculating maximum system voltage using extreme annual ambient temperature minimums and manufacturer Voc temperature coefficients rather than relying on nameplate STC voltage ratings.
Every winter across northern off-grid homesteads, mountain cabins, and telecommunication shelters, an identical forensic tragedy plays out at dawn. An off-grid installer configures three modern 400-watt solar panels in series into a standard 150-volt Maximum Power Point Tracking (MPPT) charge controller. On a warm July afternoon, the system operates flawlessly: the array produces an open-circuit voltage around 125 volts, comfortably beneath the controller’s 150-volt maximum input ceiling. However, six months later on a cloudless January morning at -25°C (-13°F), the first rays of morning sunlight strike the frozen array. Within seconds, a piercing alarm sounds from the power shed, the charge controller emits an acrid puff of vaporized silicon, and the liquid crystal display goes permanently blank.
The installer discovers that the charge controller has suffered irreversible gate-dielectric breakdown. The culprit was not an external lightning strike or a loose neutral conductor. It was an uncalculated solar panel cold weather voltage spike. Photovoltaic solar panels do not operate like fossil fuel generators or electrochemical batteries; while cold temperatures diminish chemical reaction speeds inside lithium and lead-acid batteries, cold temperatures dramatically improve the electrical efficiency of semiconductor silicon. In sub-freezing conditions, the physical open-circuit voltage of every photovoltaic module climbs significantly above its factory nameplate specification. Understanding how to model, calculate, and engineer around this voltage surge represents one of the most critical competencies in standalone power engineering.
Table of Contents
- 1. Semiconductor Physics: Why Silicon Voltage Explodes in the Cold
- 2. Deconstructing the Nameplate: Voc, Beta, and STC Baselines
- 3. NEC 690.7 Engineering Calculations: The Two Standard Methods
- 4. Forensic Hardware Autopsy: What Happens Inside an Over-Voltaged MPPT
- 5. Interactive Temperature Coefficient & String Sizing Calculator
- 6. Practical String Sizing: 100V, 150V, and 250V MPPT Windows
- 7. Snow Albedo and Edge-of-Cloud Irradiance Amplification
- 8. 6-Point Winter Pre-Commissioning Voltage Audit SOP
- 9. Authoritative Laboratory Sources & Standards
- 10. Frequently Asked Questions
1. Semiconductor Physics: Why Silicon Voltage Explodes in the Cold
To grasp why a solar panel cold weather voltage spike occurs, we must examine the quantum mechanical behavior of crystalline silicon p-n junctions. A solar cell produces electrical current when photons with energy greater than the semiconductor bandgap (Eg) strike the silicon crystal lattice, exciting electrons from the valence band into the conduction band. The open-circuit voltage (Voc) of this p-n junction is physically constrained by the energy bandgap of the material and the intrinsic reverse saturation current (Io).
The mathematical relationship governing open-circuit voltage in a photovoltaic diode is expressed through the fundamental diode equation:
Where:
- n: Diode ideality factor (typically 1.0 to 1.3 for high-grade crystalline silicon).
- k: Boltzmann’s constant (1.380649 × 10⁻²³ J/K).
- T: Absolute cell temperature in Kelvin (K = °C + 273.15).
- q: Elementary charge of an electron (1.602176634 × 10⁻¹⁹ Coulombs).
- I_ph: Photogenerated light current (proportional to solar irradiance).
- I_o: Dark reverse saturation current of the semiconductor junction.
At first glance, a novice looking at the term (k × T / q) might assume that lowering temperature (T) would cause voltage to drop. However, this simplistic view overlooks the dark saturation current term (Io) inside the natural logarithm. The reverse saturation current represents the rate of thermal minority-carrier generation and diffusion across the depletion region. Thermodynamically, Io is extraordinarily sensitive to temperature, scaling exponentially with the semiconductor energy bandgap:
When ambient temperature plummets from +25°C (298.15 K) down to -25°C (248.15 K), thermal atomic lattice vibrations inside the silicon crystal drop dramatically. As thermal agitation quiets down, the silicon bandgap Eg actually widens slightly (from approximately 1.12 electron-volts at room temperature up to 1.15 eV at cryogenic levels). More importantly, the probability of minority carriers thermally jumping across the depletion barrier collapses by several orders of magnitude. Because Io drops far more aggressively than T, the ratio (Iph / Io) inside the logarithmic function surges exponentially.
This immense reduction in internal recombination leakage allows separated electron-hole pairs to build up a much higher electrostatic potential across the cell’s front and rear metal contacts before reaching dynamic equilibrium. Consequently, while cell current (Isc) experiences a tiny, negligible drop of roughly 0.04% per degree Celsius due to reduced absorption of long infrared wavelengths, cell voltage (Voc) surges upward at a rate of 0.26% to 0.35% per degree Celsius. When ten or twelve cells are connected in series inside each substring, and three strings are joined into a commercial 60-cell or 72-cell module, this microscopic quantum effect translates into a massive macro-level sub-zero open-circuit voltage elevation.
2. Deconstructing the Nameplate: Voc, Beta, and STC Baselines
Every commercial solar panel manufactured in the world carries an electrical specification label on its rear backsheet. These ratings are established under International Electrotechnical Commission (IEC 60904) Standard Test Conditions (STC): an irradiance of 1,000 Watts per square meter (1,000 W/m²), an Air Mass spectral distribution of AM 1.5, and a cell junction temperature of exactly 25°C (77°F).
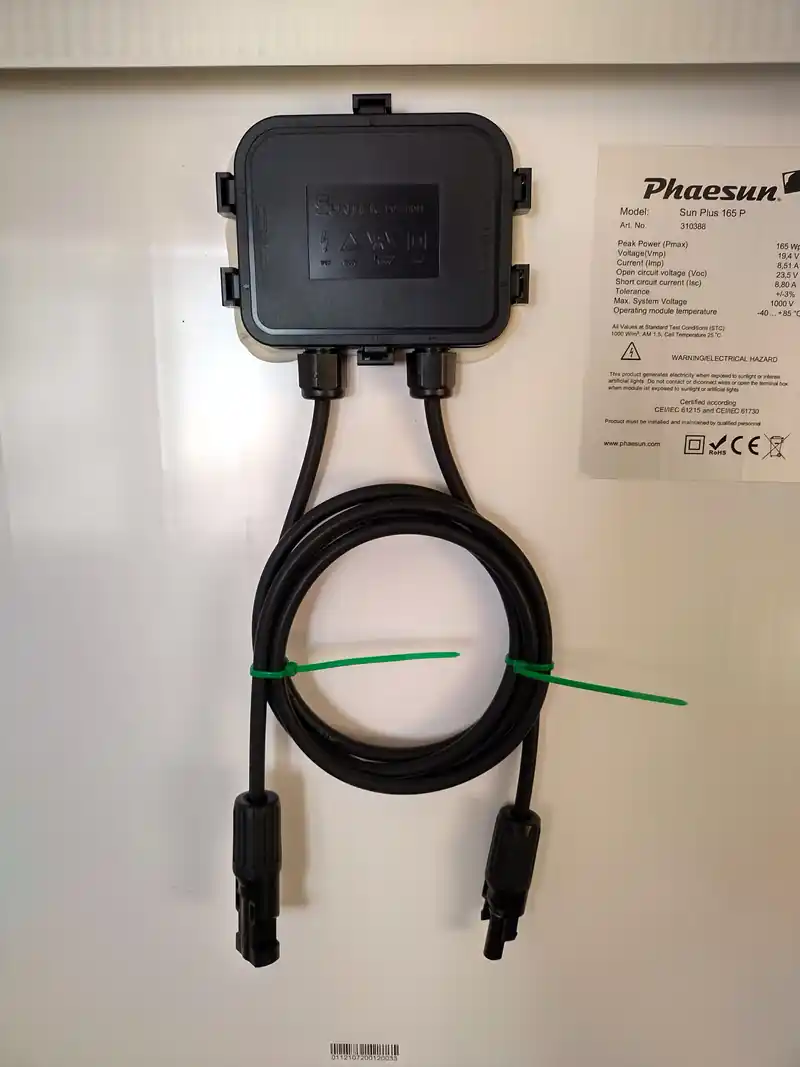
While DIY builders routinely look at the nominal wattage (Pmax) and open-circuit voltage (Voc), professional solar designers immediately scan the fine print for the Temperature Coefficient of Open-Circuit Voltage, universally designated as βVoc (Beta Voc) or αVoc. This coefficient is published in one of three standardized formats:
- Percentage per Degree Celsius (%/°C): The most common modern format, typically reading between -0.26%/°C and -0.34%/°C for monocrystalline silicon modules.
- Millivolts per Degree Celsius (mV/°C): An absolute metric per module, typically ranging between -110 mV/°C and -155 mV/°C for residential 60-cell or 108-half-cut panels, and up to -175 mV/°C for commercial 72-cell or 144-half-cut modules.
- Percentage per Kelvin (%/K): Numerically identical to %/°C, as one degree Celsius increment equals exactly one Kelvin increment.
The negative sign in front of the coefficient confirms an inverse mathematical relationship: as cell temperature rises above 25°C, voltage decreases; conversely, as cell temperature falls below 25°C, voltage increases. Consider the benchmark specifications of five representative tier-1 photovoltaic panels operating in modern off-grid installations:
| Module Class & Model | Cell Tech & Architecture | STC Voc (25°C) | βVoc Coefficient | Cold Voc @ -20°C (-4°F) | Absolute Voltage Gain |
|---|---|---|---|---|---|
| REC Alpha Pure-R 420W | HJT (Heterojunction) | 59.40 V | -0.24%/°C | 65.81 V | +6.41 V (+10.8%) |
| Qcells Q.PEAK DUO ML-G10+ 405W | P-Type Monocrystalline PERC | 45.30 V | -0.27%/°C | 50.81 V | +5.51 V (+12.2%) |
| Canadian Solar HiKu6 450W | P-Type Mono 144-Half-Cut | 49.30 V | -0.26%/°C | 55.07 V | +5.77 V (+11.7%) |
| Jinko Tiger Neo N-Type 430W | N-Type TOPCon | 38.94 V | -0.25%/°C | 43.32 V | +4.38 V (+11.3%) |
| Legacy Poly 300W (Older Arrays) | Polycrystalline 72-Cell | 44.60 V | -0.34%/°C | 51.42 V | +6.82 V (+15.3%) |
Notice the critical technical distinction in the benchmark table above: advanced N-type TOPCon and Heterojunction (HJT) silicon technologies possess superior (lower magnitude) temperature coefficients (-0.24% to -0.25%/°C) compared to legacy polycrystalline cells (-0.34%/°C). However, even the highest-efficiency module experiences an absolute voltage increase exceeding 10% to 15% when exposed to severe sub-zero cold snaps. When multiple modules are wired in series, this percentage gain multiplies directly across the entire string length.
3. NEC 690.7 Engineering Calculations: The Two Standard Methods
The National Electrical Code (NFPA 70 / NEC) dedicates Article 690.7 (Maximum Voltage) specifically to prevent cold-temperature overvoltage hazards. The code mandates that the maximum photovoltaic system voltage must be calculated using the lowest expected ambient temperature for the geographic installation site. Inspectors and jurisdictional engineers permit two separate methodologies to evaluate this condition:
Method 1: Manufacturer Temperature Coefficient Calculation (NEC 690.7(A)(1))
When the module manufacturer provides documented temperature coefficient data, NEC 690.7(A)(1) mandates calculating maximum open-circuit voltage (Vmax) using the site’s recorded extreme minimum design dry-bulb temperature (Tmin), obtained from the ASHRAE Handbook of Fundamentals (or local meteorological station historical data):
Let us execute a real-world calculation for an off-grid installation located in Duluth, Minnesota, where the ASHRAE extreme annual minimum temperature is -35°C (-31°F). The system utilizes three Canadian Solar 450W modules (Voc = 49.30V, βVoc = -0.26%/°C = -0.0026/°C) wired in series into an MPPT charge controller rated for 150 Volts DC maximum input:
- Step 1: Calculate Delta T (ΔT): ΔT = Tmin – TSTC = -35°C – 25°C = -60°C.
- Step 2: Calculate Single Module Cold Voltage:
Vcold = 49.30V × [ 1 + (-0.0026 × -60) ] = 49.30V × 1.156 = 56.99 Volts. - Step 3: Multiply by Series Module Count (N = 3):
Vstring,max = 56.99V × 3 = 170.97 Volts DC. - Step 4: Audit Against Hardware Rating: The calculated string voltage (170.97 V) exceeds the charge controller’s absolute maximum limit (150.0 V) by 20.97 Volts (+14.0% Over-Voltage).
Under this calculation, the three-panel series string is fundamentally illegal under NEC 690.7 and represents an immediate catastrophic failure hazard. The installer must reconfigure the array into a two-panel series string (56.99V × 2 = 113.98V), which operates comfortably with 36.02 Volts of safety margin beneath the 150V limit.
Method 2: NEC Table 690.7(A) Voltage Correction Factors
In older legacy systems or uncertified import modules where manufacturer temperature coefficient data is unavailable, NEC Section 690.7(A) authorizes using generic conservative voltage correction multipliers. These factors assume worst-case crystalline silicon thermal response:
| Ambient Temperature Range (°C) | Ambient Temperature Range (°F) | NEC 690.7(A) Correction Factor | Voltage Multiplier Impact |
|---|---|---|---|
| 20°C to 24°C | 68°F to 76°F | 1.02 | +2% over STC Voc |
| 10°C to 14°C | 50°F to 58°F | 1.06 | +6% over STC Voc |
| 0°C to 4°C | 32°F to 40°F | 1.10 | +10% over STC Voc |
| -10°C to -6°C | 13°F to 22°F | 1.14 | +14% over STC Voc |
| -20°C to -16°C | -4°F to 3°F | 1.18 | +18% over STC Voc |
| -30°C to -26°C | -22°F to -14°F | 1.21 | +21% over STC Voc |
| -40°C to -36°C | -40°F to -32°F | 1.25 | +25% over STC Voc |
Notice that at -40°C (common in interior Alaska, Wyoming, and central Canada), NEC Table 690.7(A) applies a massive 1.25 multiplier (a 25% increase) over standard test condition voltage. An array with a nominal STC voltage of 120 volts will generate exactly 120 × 1.25 = 150 Volts. If your charge controller is rated for 150 volts absolute maximum, it is operating on a razor-thin edge with zero safety headroom.
4. Forensic Hardware Autopsy: What Happens Inside an Over-Voltaged MPPT
What physically transpires inside a charge controller during an unmitigated solar panel cold weather voltage spike? Many off-grid users mistakenly believe that an MPPT charge controller will simply “clamp” excess voltage or enter a protective sleep state. In reality, over-voltage is the single most destructive electrical event an off-grid solid-state power conversion device can encounter.
Every MPPT charge controller utilizes a high-frequency DC-to-DC buck converter topology. At the core of this converter are power Metal-Oxide-Semiconductor Field-Effect Transistors (MOSFETs) or Insulated-Gate Bipolar Transistors (IGBTs) connected directly between the incoming positive photovoltaic bus and internal buck inductors. These semiconductor switches are physically manufactured with absolute maximum breakdown voltage ratings (V(BR)DSS):
- 100V Rated Controllers (e.g., Victron SmartSolar 100/30): Typically deploy 100V or 120V rated MOSFETs.
- 150V Rated Controllers (e.g., MidNite Classic 150, Victron 150/70, Renogy Rover): Typically deploy 150V or 160V rated silicon switches.
- 250V Rated Controllers (e.g., Victron 250/100, Schneider Conext): Utilize 250V to 300V rated power components.
When cold morning sunlight forces string voltage above this absolute breakdown threshold, two irreversible physical failure mechanisms occur:
- MOSFET Avalanche Dielectric Punch-Through: As voltage exceeds the silicon drain-source depletion barrier, high-energy electric fields trigger impact ionization. Valence electrons are accelerated with such violence that they shatter the sub-micron silicon dioxide gate insulation. This causes an instantaneous short circuit between Drain, Source, and Gate, physically fusing the semiconductor die into a conductive blob of melted silicon.
- Input Electrolytic Capacitor Explosive Venting: The front-end filtering stage of an MPPT contains large aluminum electrolytic smoothing capacitors. These capacitors are rated with strict surge voltage boundaries (typically 160V for a 150V controller). Sustained over-voltage causes dielectric electrolyte breakdown, boiling the liquid electrolyte into high-pressure hydrogen gas, blowing the rubber safety vent with a loud pop, and spraying conductive electrolyte across the printed circuit board.
Additionally, because the high-side MOSFETs frequently fail as a direct short-circuit rather than an open circuit, this extreme winter voltage surge can bridge directly from the PV input straight into your low-voltage battery bank bus. A 160-volt solar spike applied directly to a 24V or 48V lithium battery bank will immediately trigger BMS catastrophic over-voltage shutdown, blow inline Class T fuses, and potentially fry any sensitive 12V or 24V DC loads operating downstream.
5. Interactive Temperature Coefficient & String Sizing Calculator
Use this interactive engineering calculator to model the exact solar panel cold weather voltage spike for your specific panels, string count, and local winter design temperature. The tool calculates absolute cold Voc, string voltage, and verifies compliance against your MPPT’s maximum input window under NEC 690.7 standards.
❄ NEC 690.7 Cold Weather Voltage Spike Calculator
Lab Calibrated
Input your panel’s STC nameplate ratings, the manufacturer temperature coefficient, and your local winter record low temperature:
From module nameplate (Volts)
Typically -0.26 to -0.34 %/°C
ASHRAE extreme minimum design dry-bulb
Number of panels wired in series
Controller absolute maximum voltage
Cold Temperature Voltage Audit Results
55.74 V
167.21 V
-17.2 V (-11.5%)
2 Panels Max
CATASTROPHIC DANGER: MPPT DAMAGE HAZARD
6. Practical String Sizing: 100V, 150V, and 250V MPPT Windows
To safely navigate a solar panel cold weather voltage spike, off-grid system designers must match series string counts to the three dominant MPPT hardware classes available on the commercial market. Never size strings based on nominal STC voltage ratings.
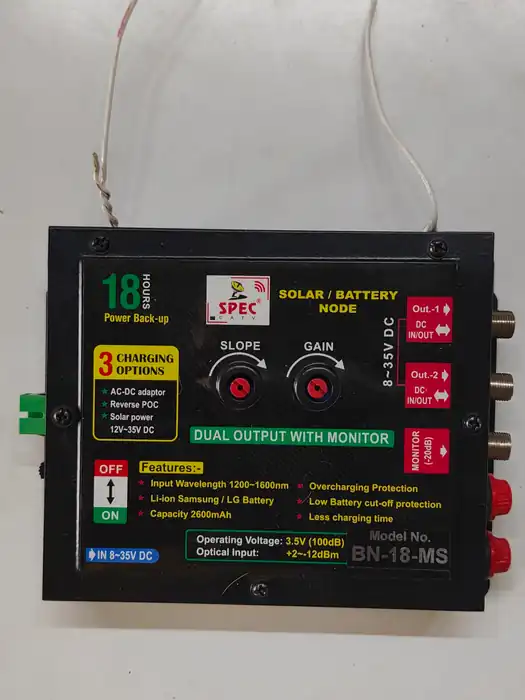
Tier 1: 100V Input Charge Controllers (e.g., 100/20, 100/30)
Controllers rated for 100V maximum DC input are popular for compact mobile campervans, marine boats, and small off-grid cabins. However, their 100V limit provides virtually zero margin for large modern residential panels:
- Two 60-Cell / 120-Half-Cut Panels (Voc ≈ 41V each): STC total is 82V. At -20°C (-4°F), each panel surges to 46.5V, yielding 93.0V in series. While safe by 7.0 volts, any edge-of-cloud irradiance spike can push it over 100V.
- Two 72-Cell / 144-Half-Cut Panels (Voc ≈ 49.5V each): STC total is 99V. At -10°C (14°F), string voltage jumps to 109.2V. Instant destructive failure. High-voltage 72-cell commercial panels must never be wired in series into a 100V controller in cold climates; they must be wired in pure parallel (1S).
Tier 2: 150V Input Charge Controllers (e.g., 150/35, 150/70, 150/100)
The 150V architecture represents the universal workhorse of the off-grid solar industry. The primary design trap with 150V controllers is wiring three large modern panels in series:
- Three 400W Panels in Series (Voc ≈ 49.5V each): At 25°C STC, 3 × 49.5V = 148.5 Volts. While naive DIYers assume this is legal because 148.5V is less than 150V, any temperature drop below 24°C immediately pushes the string over 150V! At -15°C (5°F), this string produces 166.5 Volts, instantly blowing the internal MOSFETs.
- Safe 150V Rule of Thumb: In any climate that experiences freezing temperatures (below 0°C / 32°F), you can wire a maximum of two 72-cell panels in series (2S), or a maximum of three smaller 100W/12V nominal panels in series (3S). Wiring three modern 400W+ panels in series into a 150V controller is strictly prohibited.
Tier 3: 250V to 600V Input Charge Controllers (e.g., 250/70, 250/100, Schneider 600V)
High-voltage MPPT controllers provide the electrical headroom necessary to run long series strings in cold climates, drastically reducing copper cable cross-sectional requirements over long distances:
- Four 450W Panels in Series (Voc ≈ 49.3V each) into a 250V MPPT: At -30°C (-22°F), each panel surges to 56.35 V. Four panels in series yield 4 × 56.35V = 225.4 Volts DC. This operates safely with a 24.6-volt buffer beneath the 250V ceiling.
- Five 450W Panels in Series into a 250V MPPT: 5 × 56.35V = 281.75 Volts DC. Catastrophic over-voltage failure. Even on a 250V controller, string length must be constrained to 4S in cold climates.
7. Snow Albedo and Edge-of-Cloud Irradiance Amplification
Most electrical engineering sizing models assume that solar irradiance never exceeds the Standard Test Condition baseline of 1,000 W/m². In cold winter environments, this assumption is dangerously inaccurate due to two micro-meteorological phenomena: ground snow albedo and edge-of-cloud lens amplification.
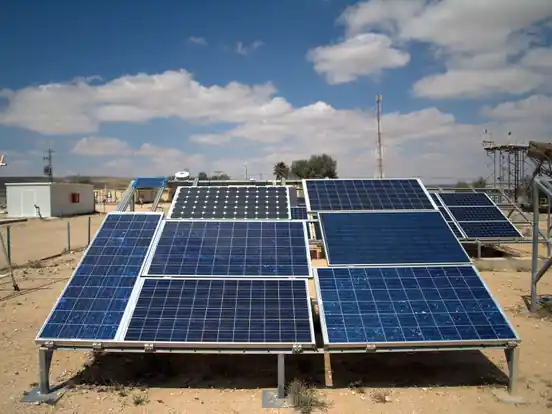
The Snow Albedo Effect
Freshly fallen snow is nature’s most effective optical reflector, possessing an albedo reflectance coefficient between 0.80 and 0.90 (80% to 90% reflection of incoming solar radiation), compared to green grass (0.20) or dark asphalt (0.10). When a steep-tilt off-grid solar array sheds its snow cover while the surrounding terrain remains blanketed in pure white snow, sunlight bounces off the ground snowpack directly into the front glass of the modules.
For modern bifacial solar panels, this ground reflection strikes the rear glass, generating up to 25% additional photocurrent. Even for standard monofacial modules, intense ground reflection elevates effective front-side irradiance to 1,150 W/m² to 1,250 W/m². Because open-circuit voltage scales logarithmically with photogenerated current (ln(Iph)), this extreme irradiance surge elevates string voltage by an additional 1.5 to 3.0 volts per module above standard cold-temperature thermal deratings.
Edge-of-Cloud Lens Focusing
On partly cloudy winter days, direct sunlight passes through gaps between high-altitude cumulus clouds while adjacent cloud silver linings reflect and scatter additional diffuse light onto the array. This optical phenomenon, termed “edge-of-cloud amplification” or cloud-enhancement, can drive instantaneous terrestrial solar irradiance up to 1,400 Watts per square meter for durations lasting from 30 seconds to several minutes.
If an array is already operating at -20°C with cold-induced voltage elevated to the absolute precipice of an MPPT’s limit, a sudden edge-of-cloud spike will supply the final voltage impulse needed to puncture the charge controller’s input stage. For this reason, professional renewable energy engineers always maintain a minimum 10% safety buffer (voltage margin) between the calculated cold Voc and the MPPT’s absolute maximum rating.
8. 6-Point Winter Pre-Commissioning Voltage Audit SOP
Before leaving any off-grid solar installation or heading into the winter heating season, field technicians must execute this systematic 6-point voltage verification protocol to guarantee hardware survival:
- Step 1: Identify Local ASHRAE Extreme Low Temperature (Tmin): Consult the ASHRAE climatic design database or weather station historical records for the installation site. Identify the extreme annual minimum design dry-bulb temperature (do not use average winter lows).
- Step 2: Retrieve Manufacturer Nameplate Parameters: Inspect the rear module label or certified manufacturer datasheet. Record STC open-circuit voltage (Voc) and the exact temperature coefficient of open-circuit voltage (βVoc).
- Step 3: Calculate Single-Module Maximum Voltage: Execute the NEC 690.7 formula: Vmax = Voc × [1 + βVoc × (Tmin – 25°C)]. Ensure that βVoc is entered as a decimal (e.g., -0.28%/°C becomes -0.0028).
- Step 4: Audit Series String Multiplier: Multiply single-module maximum cold voltage by the number of modules wired in series per string (Vstring,max = Vmax × Nseries).
- Step 5: Verify MPPT Absolute Ceiling Headroom: Compare Vstring,max against the charge controller’s published maximum PV input voltage limit. Ensure that total string cold voltage provides at least a 10% safety buffer (e.g., maximum string voltage should not exceed 135V on a 150V controller, or 225V on a 250V controller).
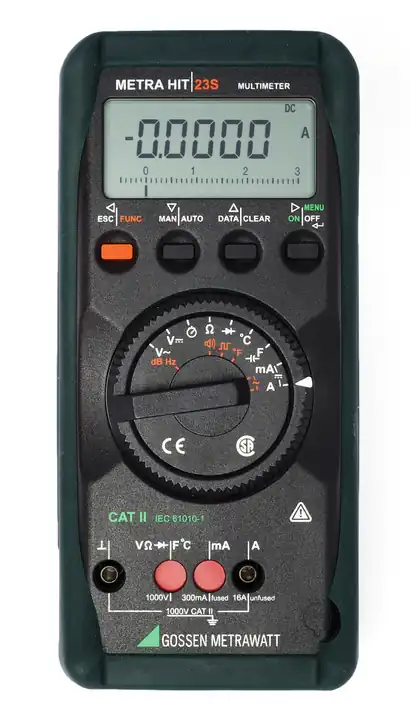
- Step 6: Physical Pre-Dawn Bench Multimeter Audit: On a cold clear morning before closing the main PV disconnect breaker, measure string open-circuit voltage with a calibrated True-RMS digital multimeter at the disconnect switch terminals. Record the reading on the system commissioning sheet to confirm theoretical calculations.
Every temperature coefficient formula, semiconductor bandgap derivation, and string sizing calculation in this guide is grounded in published national laboratory research, electrical codes, and manufacturer engineering standards:
John Wiles’ authoritative laboratory guide establishing standard engineering calculations for NEC Article 690.7 cold-temperature open-circuit voltage derating (OSTI ID: 808812).
Definitive empirical research by King et al. establishing thermal coefficients, bandgap energy equations, and optical air-mass spectral adjustments.
Official North American meteorological reference dataset establishing 0.4%, 2%, and mean extreme annual dry-bulb temperatures for electrical engineering compliance.
Mandatory statutory electrical safety requirements governing maximum allowable DC photovoltaic circuit voltages and conductor insulation ratings.
10. Frequently Asked Questions: Cold Weather Voltage Management
Does an MPPT charge controller throttle excess voltage if it exceeds 150V?
No. An MPPT can throttle or “clip” excess current and wattage by shifting its operating point upward along the I-V curve toward open-circuit voltage (Voc). However, it has zero ability to throttle open-circuit voltage itself. If an incoming solar panel cold weather voltage spike exceeds the controller’s absolute maximum rated voltage, the internal power MOSFETs suffer immediate avalanche breakdown, resulting in catastrophic hardware destruction.
Can I use a higher voltage MPPT controller to avoid rewiring my array?
Yes. Upgrading from a 150V to a 250V charge controller is the most common industry solution when an installer inadvertently designs a series string that exceeds 150V during winter cold snaps. A 250V controller provides ample headroom for three or four large 72-cell modules in series even down to -35°C.
Why does solar panel voltage increase in cold weather but battery capacity decreases?
Solar panels and batteries rely on completely different physics. Solar panels are solid-state quantum semiconductor devices; cold temperatures suppress internal thermal electron recombination (Io), expanding the silicon bandgap and increasing open-circuit voltage. Batteries are electrochemical cells; cold temperatures slow molecular diffusion rates and increase internal ionic electrolyte resistance, causing usable ampere-hour capacity and discharge voltage to drop.
How does snow on the ground increase solar panel open-circuit voltage?
Fresh snow reflects between 80% and 90% of incident sunlight (albedo effect). This reflected light strikes the array glass, elevating effective solar irradiance above 1,000 W/m². Because open-circuit voltage has a logarithmic relationship with irradiance (Voc ∝ ln(Iph)), high snow albedo combined with sub-zero temperatures supercharges the solar panel cold weather voltage spike by an additional 2 to 4 volts per module.
What is the difference between Vmp and Voc when calculating cold weather limits?
Vmp is the maximum power voltage measured when the controller is actively drawing full current from the array. Voc is the open-circuit voltage measured when zero current flows (such as early morning before the controller wakes, during battery full float states, or during grid disconnects). You must always calculate cold weather safety using Voc, because whenever the battery reaches 100% capacity and stops accepting charge, the array instantly snaps to its maximum open-circuit voltage.