A resting LiFePO4 voltage chart maps state of charge across flat discharge curves: 100% SoC sits at 13.60V (12V) / 27.20V (24V) / 54.40V (48V) after settling, 50% sits at 13.08V / 26.16V / 52.32V, and 10% drops to 12.00V / 24.00V / 48.00V before plunging to 10.0V BMS cutoff.
In lead-acid battery banks, a handheld digital voltmeter provides an immediate, reliable indicator of stored capacity: open-circuit voltage slopes downward in a predictable linear line from 12.73V down to 11.80V. With Lithium Iron Phosphate (LiFePO4 or LFP) chemistry, that conventional diagnostic intuition fails completely. Between 20% and 80% State of Charge (SoC), a 12-volt LiFePO4 battery rests on an extraordinarily flat voltage plateau—often hovering around 13.20V to 13.25V whether it has harvested 75% of its capacity or is nearly depleted. Relying solely on raw terminal voltage under fluctuating inverter loads routinely deceives off-grid builders into misjudging remaining autonomy.
To accurately monitor lithium storage, installers must decouple active charging voltages from stabilized open-circuit potential after surface charge has dissipated. Consulting an engineering-calibrated lifepo4 voltage chart provides the precise millivolt benchmarks required to correlate resting terminal measurements across 1S, 4S (12V), 8S (24V), and 16S (48V) architectures, configure solar charge controller thresholds, and spot dangerous cell imbalance before your battery management system (BMS) triggers an unexpected low-voltage disconnect.
Interactive LiFePO4 Voltage & State of Charge Calculator
Select your system battery pack configuration and measurement conditions, then enter your measured terminal voltage to evaluate exact State of Charge (SoC %), average per-cell voltage, and recommended charge controller thresholds.
Direct Amazon Link
Because LiFePO4 maintains an ultra-flat voltage curve between 20% and 80% SoC, standard voltmeters cannot accurately determine battery capacity. A coulomb-counting shunt measures net amp-hours entering and leaving the battery bank:
- Real-time State of Charge (%), Remaining Runtime, Voltage & Current
- Connects wirelessly to iOS/Android via VictronConnect App
The Flat Discharge Curve Dilemma: Chemistry of Lithium Iron Phosphate
To grasp why a lifepo4 voltage chart looks radically different from other battery chemistries, one must examine the internal electrochemical phase transition of the cathode. In an LFP cell, lithium ions (Li+) insert and de-insert between iron phosphate (FePO4) crystal lattices during charging and discharging.
Unlike lithium nickel manganese cobalt (NMC) or lead-acid chemistries—where chemical activity shifts across a continuously changing concentration gradient that alters electrical potential—the two-phase transition in LiFePO4 ↔ FePO4 occurs at a remarkably steady thermodynamic equilibrium potential of approximately 3.42V per cell at room temperature. As a result, approximately 70% to 80% of the entire usable energy of an LFP cell discharges within a tiny window of just 0.10 Volts (between 3.32V and 3.22V per cell).
For a standard 12V (4-cell in series) battery pack, this means the terminal voltage lingers between 13.28V and 12.88V for nearly the entire discharge cycle. A standard voltmeter reading 13.10V could indicate a battery sitting at 75% capacity, or one discharged down to 40% capacity. Relying on an uncalibrated digital display without an exact resting lifepo4 voltage chart and a coulomb-counting shunt leads to severe miscalculations in available runtime.
Complete LiFePO4 State of Charge (SoC) Master Reference Table
The following engineering reference table outlines the precise correlation between resting open-circuit voltage (OCV) and State of Charge (SoC) percentages across individual cells (1S), 12V batteries (4S), 24V batteries (8S), and 48V power banks (16S). These values assume stabilized resting conditions with no load or charging current present for at least 30 minutes at 25°C (77°F).
| State of Charge (SoC %) | 1S Single Cell (Nominal 3.2V) | 4S 12V Pack (Nominal 12.8V) | 8S 24V Pack (Nominal 25.6V) | 16S 48V Pack (Nominal 51.2V) | Cell Operating State & Chemistry Status |
|---|---|---|---|---|---|
| 100% (Charging Peak) | 3.65 V | 14.60 V | 29.20 V | 58.40 V | Maximum absorption threshold; active charging current present |
| 100% (Settled Resting) | 3.40 V | 13.60 V | 27.20 V | 54.40 V | Full resting capacity; surface charge dissipated |
| 90% | 3.35 V | 13.40 V | 26.80 V | 53.60 V | Upper voltage shoulder; high stored chemical reserve |
| 80% | 3.33 V | 13.32 V | 26.64 V | 53.28 V | Entrance to flat operating plateau; optimal storage level |
| 70% | 3.30 V | 13.20 V | 26.40 V | 52.80 V | Flat operating plateau; high discharge efficiency |
| 60% | 3.28 V | 13.12 V | 26.24 V | 52.48 V | Flat operating plateau; minimal internal resistance |
| 50% | 3.27 V | 13.08 V | 26.16 V | 52.32 V | Exact mid-capacity plateau; ultra-stable voltage delivery |
| 40% | 3.25 V | 13.00 V | 26.00 V | 52.00 V | Flat operating plateau; consistent power output |
| 30% | 3.22 V | 12.88 V | 25.76 V | 51.52 V | Lower boundary of flat plateau; begin solar planning |
| 20% | 3.20 V | 12.80 V | 25.60 V | 51.20 V | Discharge knee begins; voltage starts dropping rapidly |
| 10% | 3.00 V | 12.00 V | 24.00 V | 48.00 V | Steep discharge slope; recharge immediately |
| 5% | 2.80 V | 11.20 V | 22.40 V | 44.80 V | Critical depletion zone; high risk of cell imbalance |
| 0% (BMS Cutoff) | 2.50 V | 10.00 V | 20.00 V | 40.00 V | Absolute low-voltage disconnect; BMS cuts discharge MOSFETs |
LiFePO4 Voltage Misconceptions: Technical Analysis & DIY Myth Busting
General consumer guides routinely publish oversimplified voltage tables that ignore surface charge decay and dynamic load sag. The comparative matrix below debunks common DIY voltage myths using electrochemical test data:
| Common DIY Myth / Assumption | Electrochemical & Physical Reality | Oversimplified Advice in Generic Guides | OffGridSolarCalc Engineering Standard |
|---|---|---|---|
| “A 12V LiFePO4 battery is 100% full when it reads 14.6V at rest” | 14.6V represents active absorption charging voltage. Once current ceases, surface charge dissipates within 30–60 minutes and true resting potential settles to 13.60V (3.40V/cell). | Fails to distinguish between charging voltage and settled open-circuit resting potential. | Reference resting OCV only after a 30-minute current-free rest period, or measure via coulomb-counting shunt. |
| “You can measure LiFePO4 State of Charge with a handheld voltmeter under load” | Because LFP discharge curves are virtually flat between 20% and 80% SoC, active inverter discharge draws terminal voltage down by 0.1V to 0.4V due to internal IR drop. | Claims voltage-to-percent tables work under active appliance loads. | Decouple active load voltage sag from resting OCV; calibrate LVD thresholds to protect against momentary inverter surges. |
| “Equalization charging is safe for lithium batteries” | Equalization pushes voltages above 15.0V to de-sulfate lead-acid plates. In LiFePO4, voltages above 3.65V/cell trigger electrolyte decomposition, cathode degradation, and BMS disconnect. | Leaves charge controller in default lead-acid presets with active equalization. | Strictly disable equalization and temperature compensation (0.0 mV/°C) in solar charge controller firmware. |
Resting Open-Circuit Voltage (OCV) vs. Under-Load vs. Charging Voltages
The single greatest source of confusion when applying a lifepo4 voltage chart in real-world off-grid installations is failing to distinguish between open-circuit resting voltage and active operational voltage. Voltage measured at battery terminals is governed by three distinct operating states:
1. Resting Open-Circuit Voltage (Stabilized OCV)
To measure true resting OCV, the battery bank must be completely disconnected from all electrical loads and solar charging sources for a minimum of 30 to 60 minutes. During active charging or discharging, chemical concentration gradients and electrochemical double-layer capacitance alter terminal voltage. Once left at rest, the electrolyte settles to equilibrium, revealing true chemical potential. All standard state of charge charts—including our lifepo4 voltage chart—are calibrated exclusively to resting OCV.
2. Dynamic Voltage Under Load (IR Sag)
When an inverter draws 100 Amperes to power an induction cooktop or water pump, the internal resistance (Rint) of the cells, copper busbars, and terminal connections causes an instantaneous voltage drop known as I × R sag (Vterminal = VOCV – [I × Rint]). A healthy 12V pack at 60% capacity (13.12V resting) can easily sag down to 12.60V under a heavy 0.5C discharge. This voltage dip is temporary; as soon as the load turns off, the voltage rebounds back toward its resting plateau.
3. Charging Voltage (Overpotential)
Conversely, while your MPPT solar charge controller pumps 40 Amperes of photovoltaic current into the battery, terminal voltage is pushed higher than the resting potential due to internal chemical impedance and charge acceptance overpotential (Vterminal = VOCV + [I × Rint]). A battery pack at 70% capacity will show 13.80V on the solar charge controller screen while charging, but will settle to 13.20V thirty minutes after sunset.
The Three Charging Phases: CC/CV Profiles and Why Equalization Destroys LFP
Charging lithium iron phosphate batteries requires a dedicated Constant Current / Constant Voltage (CC/CV) algorithm. Attempting to charge LiFePO4 batteries using old lead-acid profiles will degrade cell lifespan or permanently destroy the pack.

Phase 1: Constant Current (Bulk Phase)
During the bulk stage, the charge controller delivers maximum available solar current into the battery while terminal voltage rises steadily from its depleted level up to the bulk threshold. Unlike lead-acid batteries, which absorb charge slowly and experience high internal resistance as they fill, LiFePO4 accepts high continuous charging current with near 99% coulombic efficiency up to approximately 95% capacity.
Phase 2: Constant Voltage (Absorption Phase)
Once the battery bank reaches the absorption threshold—recommended at 14.2V to 14.4V for a 12V system (3.55V–3.60V/cell)—the controller holds this voltage constant. As the cells reach saturation, the incoming current naturally tapers down toward zero. In lithium systems, the absorption phase should be brief (typically 15 to 30 minutes). Holding LiFePO4 at elevated voltages (3.65V/cell) for hours degrades electrolyte integrity and promotes lithium plating on the graphite anode.
Phase 3: Float Stage (Standby Mode)
Once absorption terminates, the charge controller drops voltage down to a gentle float setting—recommended at 13.5V to 13.6V for 12V packs (3.375V–3.40V/cell). In a solar system, float voltage does not actively charge the lithium battery; instead, it powers daytime house loads directly from solar panels while keeping the battery fully saturated without chemical stress.
Fatal Danger: Disable Equalization Mode Immediately!
Traditional flooded lead-acid battery chargers incorporate an automatic periodic “Equalization” mode that spikes charging voltage to 15.5V–16.2V to de-stratify liquid acid and burn off sulfate crystals. Equalization will destroy a LiFePO4 battery pack. Voltages exceeding 14.8V (3.70V/cell) trigger violent BMS high-voltage disconnects, cook internal electrolyte, and can permanently ruin cell separators. Always disable equalization or select a dedicated “Lithium / LFP” profile on your solar equipment.
Battery Management Systems (BMS), Cell Drift and Top-Balancing
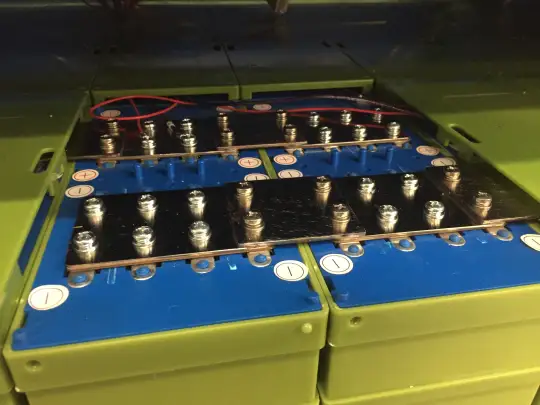
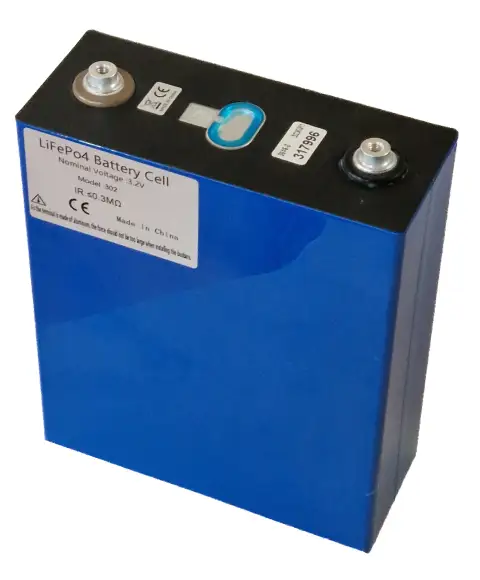
A lithium iron phosphate battery pack is not a single monolithic entity; it is an assembly of individual 3.2V electrochemical cells wired in series. A 12V battery contains 4 cells (4S), a 24V battery contains 8 cells (8S), and a 48V battery contains 16 cells (16S). The total terminal voltage displayed on your inverter is merely the aggregate sum of every individual cell in the string.

The Danger of Cell Imbalance (Drift)
Because no two manufacturing runs produce identical internal resistances or capacities, individual cells naturally experience slight divergence in charging rates over hundreds of cycles. In a 12V pack charging at 14.4V, you might assume all four cells sit evenly at an ideal 3.60V (14.4 / 4 = 3.60V). However, if the pack suffers from cell drift, the reality could be:
Even though the overall pack voltage reads a normal 14.40V, Cell 4 is suffering catastrophic overvoltage that destroys its separator, while Cells 1 and 2 remain undercharged. The Battery Management System (BMS) prevents this catastrophe by monitoring individual cell voltages via balance leads. If any single cell exceeds 3.65V or plunges below 2.50V, the BMS opens its solid-state MOSFET switches and shuts down the entire battery bank.
Top-Balancing and Active Balancers
To eliminate drift, quality lithium installations incorporate two balancing practices:
- Bench Top-Balancing (Before Initial Assembly): New DIY prismatic cells must be wired in parallel across solid copper busbars and charged slowly with a regulated benchtop power supply up to 3.65V until current drops below 1 Amp. This synchronizes the chemical saturation point of every cell across the entire bank.
- Passive vs. Active BMS Balancing: Standard drop-in batteries feature passive bleeder balancing that burns off tiny amounts of excess current (30mA–100mA) as heat through resistors when cells exceed 3.40V. On large capacity DIY banks (200Ah–300Ah+), adding a dedicated capacitive active balancer (1A–5A transfer rate) actively moves energy from high cells to low cells, maintaining sub-15mV cell delta across the flat plateau.
Why You Need a Shunt-Based Battery Monitor Instead of a Voltmeter
While an accurate lifepo4 voltage chart is indispensable for setting charge controller cutoff voltages and performing resting system health audits, relying solely on a voltmeter for everyday state of charge tracking in an active solar system is an exercise in frustration. Because the discharge curve is virtually flat between 30% and 80% capacity, a temporary 0.05V drop caused by an inverter running a coffee maker will fool a standard voltage gauge into reporting that the battery dropped by 25% capacity.
The only engineering-grade solution for monitoring active LiFePO4 solar batteries is a coulomb-counting shunt monitor (such as a Victron SmartShunt or BMV-712). A precision shunt is installed directly in series with the negative battery cable. Rather than estimating capacity from unstable surface voltage, the shunt measures the precise microscopic flow of electrical current in and out of the battery bank millisecond by millisecond, integrating net ampere-hours over time (Ah = ∫ I dt). When combined with periodic automatic synchronizations at 100% full charge (when voltage exceeds 14.2V and tail current drops below 2%), a shunt provides real-time State of Charge accuracy within 1%.
Three Real-World Field Scenarios
Scenario 1: 12V 200Ah Campervan Lithium Battery at Rest
Observation: A van lifer wakes up in the morning before sunrise. The 12V 200Ah battery bank has been powering a 12V compressor refrigerator all night with no solar input. A multimeter placed across the main battery terminals reads 13.10 Volts.
- Consulting the LiFePO4 Voltage Chart: In a 4S system, 13.12V corresponds to approximately 60% SoC, and 13.08V represents 50% SoC. Because the compressor was cycling lightly, average resting potential is approximately 13.10V, indicating the bank sits comfortably at 55% State of Charge.
- Action: The battery is in its optimal flat operating plateau with roughly 110Ah of stored energy remaining. Normal morning solar charging will easily restore full saturation by noon.
Scenario 2: 24V 280Ah Off-Grid Cabin Bank Premature Inverter Cutoff
Observation: An off-grid cabin owner runs a washing machine from a 24V 280Ah DIY battery bank (8S prismatic cells). The inverter suddenly trips off with a low-voltage alarm, despite the wall monitor reading 25.60 Volts (which our lifepo4 voltage chart indicates is 20% SoC).
- Diagnostic Investigation: Using a cell-level Bluetooth BMS app, the owner inspects individual cell voltages during the surge:
Cells 1–7 read 3.22V each (7 × 3.22 = 22.54V). Cell 8 had drifted severely and plunged down to 2.45V under the washing machine motor inrush!
- Root Cause: The BMS low-voltage protection triggered because Cell 8 hit its emergency cutoff threshold (2.50V), even though the overall pack voltage (24.99V under load) appeared safe on the inverter display.
- Resolution: The owner brought the pack to full charge, conducted a manual top-balance on Cell 8, and installed an active balancer to equalize cell capacity.
Scenario 3: 48V Whole-Home Solar Bank Float Configuration
Observation: A homeowner with a 15 kWh 48V (16S) server-rack battery bank observes their hybrid solar inverter holding the battery at 58.4 Volts (3.65V/cell) for five hours every afternoon.
- Engineering Assessment: 58.4V represents the absolute maximum permissible absorption threshold. Holding lithium cells at 3.65V continuously after current has dropped to zero exposes the positive cathode to accelerated oxidative stress and shortens battery calendar life.
- Configuration Fix: The owner reprograms the inverter charging settings based on our lifepo4 voltage chart:
Bulk/Absorption set to 56.8V (3.55V/cell) with a 20-minute absorption timer, and Float set to 54.0V (3.375V/cell). The battery charges to 99% capacity with zero cell strain and extended 15-year longevity.
Step-by-Step Commissioning & Parameter Configuration Checklist
When commissioning a new LiFePO4 battery installation, program your solar charge controller and inverter according to these field-tested settings:
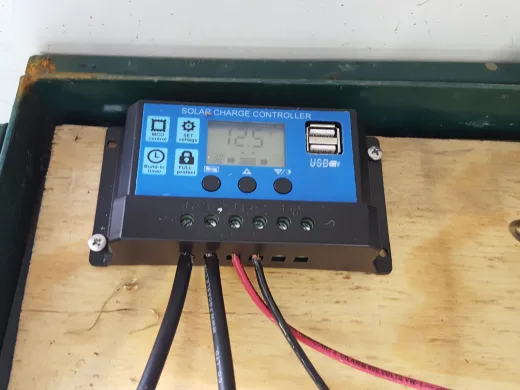
- Select “User Defined” or Dedicated “Lithium / LFP” Battery Type: Never leave charge controllers in default “Lead-Acid”, “AGM”, or “Gel” presets, as these incorporate temperature compensation and automatic equalization cycles that damage lithium cells.
- Disable Temperature Compensation: Lead-acid chargers adjust voltage upward in cold weather (e.g., -3mV/°C/cell). LiFePO4 chemistry must never be charged at elevated voltages in cold temperatures. Set temperature compensation to 0.0 mV/°C.
- Program Exact Absorption Voltage: Set bulk/absorption to 14.2V–14.4V (12V), 28.4V–28.8V (24V), or 56.8V–57.6V (48V). This provides 100% capacity replenishment while preventing individual cell overvoltage spikes.
- Set Absorption Time to 15–30 Minutes: Unlike lead-acid batteries that require 2 to 4 hours of absorption to drive chemical conversion, LiFePO4 saturation is virtually instantaneous once the absorption threshold is reached.
- Program Float Voltage to 13.5V–13.6V (12V) / 27.0V–27.2V (24V) / 54.0V–54.4V (48V): This holds the battery at settled resting saturation without continuous current push.
- Set Inverter Low-Voltage Disconnect (LVD): Program your inverter to shut down at 11.5V (12V) / 23.0V (24V) / 46.0V (48V). This leaves a safe 10% to 15% reserve buffer, preventing the internal BMS from tripping abruptly under heavy surge loads.
Frequently Asked Questions (FAQ)
1. Why does my LiFePO4 battery voltage drop from 14.4V to 13.6V right after charging?
This voltage drop is completely normal and expected. When charging, your solar charge controller holds the battery at an elevated absorption voltage (14.2V–14.6V) to overcome internal cell impedance and push current through the cathode. As soon as the charger turns off, this artificial surface charge dissipates within 30 to 60 minutes, and the chemical potential settles to its true 100% resting open-circuit voltage of approximately 13.60V (3.40V/cell). Your battery has not lost any stored energy.
2. Can I check LiFePO4 battery health with a standard automotive battery tester?
No. Handheld automotive carbon-pile or impedance testers are calibrated exclusively for starting lead-acid batteries measuring Cold Cranking Amps (CCA). They apply heavy pulse loads expecting a predictable lead-acid impedance curve. Connecting these testers to a LiFePO4 battery will yield false readings and can trigger the internal BMS short-circuit or overcurrent protection.
3. What happens if an individual LiFePO4 cell drops below 2.50 Volts?
When an LFP cell drops below 2.50V, copper ions from the anode current collector begin dissolving into the liquid electrolyte. If left in an over-discharged state, recharging the battery causes the dissolved copper to precipitate into sharp metallic dendrites that pierce the polymer separator, causing an internal short circuit and permanent cell death. A properly configured BMS disconnects the load before cell voltage reaches 2.50V.
4. How does cold temperature affect my LiFePO4 voltage chart readings?
In sub-zero temperatures (below 0°C / 32°F), lithium ion diffusion through the electrolyte slows down dramatically, substantially increasing internal resistance. Under discharge loads, cold LiFePO4 batteries experience significantly greater voltage sag than at 25°C. Crucially, charging LiFePO4 cells below freezing causes permanent lithium metal plating on the anode, creating severe fire hazards. Always ensure your battery features low-temperature charging cutoff protection.
5. Why does my BMS shut down even when overall pack voltage looks normal?
The Battery Management System monitors every individual series cell, whereas your inverter or voltmeter only sees the total cumulative pack voltage. If one cell has degraded capacity or severe drift, it may plummet to 2.45V during a load surge while the remaining cells sit comfortably at 3.25V. The BMS immediately disconnects to protect that single weak cell, despite the pack reading a seemingly safe aggregate voltage.